What a 24 hour chart shows
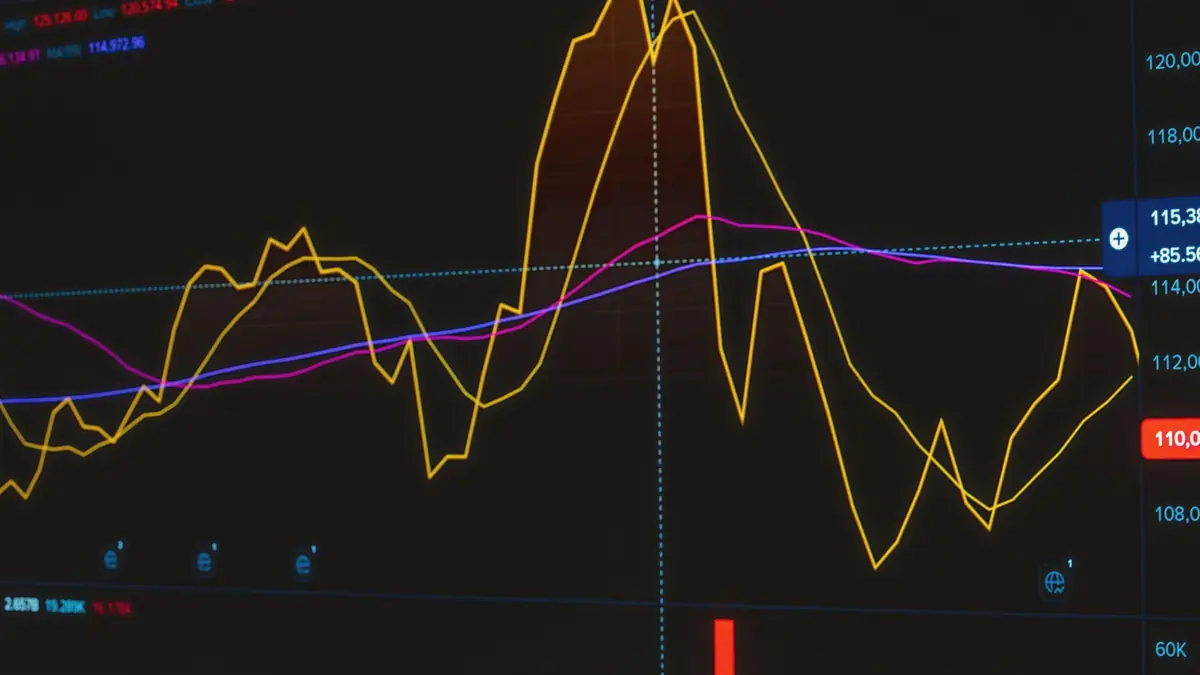
A twenty four hour gold chart plots the traded price through a full global day, from the Asian session through London to New York. It is a picture of trading activity, not of a fixed price: at any given second there is a bid and an ask, and the line on the chart is a summary of where business is happening.
That is different from the published benchmark. The benchmark figure that contracts and settlements reference is the LBMA Gold Price, operated by ICE Benchmark Administration and set twice a day, at 10:30 and 15:00 UK time, in US dollars, through an electronic auction rather than a survey (LBMA Gold Price FAQs). A chart shows the whole day; the benchmark is two specific points in it.
Reading one without fooling yourself
Three habits prevent most misreadings.
- Check the vertical scale before the shape. A chart scaled to a twenty dollar range makes an ordinary day look like a crisis. The shape of the line is a drawing choice; the numbers at the side are the fact.
- Check the currency and the unit. Benchmark gold is quoted in US dollars and auction volumes are entered in ounces. A chart in another currency carries the exchange rate's movement as well as the metal's.
- Check the timestamp and the time zone. The two daily settings are named AM and PM for a reason, and a figure quoted without saying which one it is cannot be reconciled with anything.
Why the chart is not your price
The number on a live chart is a wholesale price for standardised deliverable metal. What a collector sells is small, varied and needs checking, so a dealer quote sits below the chart by a spread that covers handling, risk and margin. The spread on a small mixed lot is routinely wider than a whole day's movement on the chart, which is why watching the chart before a small sale rarely changes the outcome.
Where the chart does matter is on larger transactions and on anything priced by formula. If a deal is written as a percentage of spot, the important question is not where the chart is now but which published setting, on which date, the contract names. The spot prices section sets out how that benchmark is produced, including the 10,000 ounce imbalance tolerance that ends each auction.
Numismatic value moves separately
Metal price and collector price are two different markets, and they can move in opposite directions in the same month. A scarce coin in high grade is priced by what collectors will pay for that coin in that grade, and the metal in it may be a small part of the total. A common dated coin in worn condition is priced by its metal, and nothing else about it matters.
The dividing line runs through most inherited holdings. Sorting a box into "has collector value" and "is metal" is the first job, and it is the job a general coin shop does; the dealers page covers how to find one that will do it properly rather than weighing everything.
A worked example of the metal question
Take a jar of United States quarters. Those dated 1964 and earlier are 90 per cent silver. Those struck afterwards are copper nickel clad: 91.67 per cent copper, 8.33 per cent nickel, 5.67 grams, 24.26 millimetres across. The silver proof quarters of the state series are the exception, at 90 per cent silver and 6.25 grams (50 State quarters, specifications).
So the metal question for that jar is answered by sorting on one date, not by watching a chart. For the clad coins the chart is irrelevant at any price; for the silver ones it sets the floor, and the New Mexico quarter page shows how to tell the two versions apart by weight and edge.
Where to look
For the benchmark itself, its times and its methodology, the London Bullion Market Association's own prices pages are the primary source and the one worth bookmarking. For intraday charts, any major metals service will do, and the choice matters far less than reading the scale properly. For the history of the arrangement, note that the older London Gold Fix ceased at the close of business on 19 March 2015 and the current benchmark has run since the following day, becoming a regulated benchmark on 1 April 2015; valuations and wills drafted before that date may still use the old term.